Science Unit 6
Scientific method/ Measurement/Graphing
Trigger Assignment: Students measure themselves in as many ways as possible.
Text/Notes: 7th grade text, Chapter 1 pp. 3-20
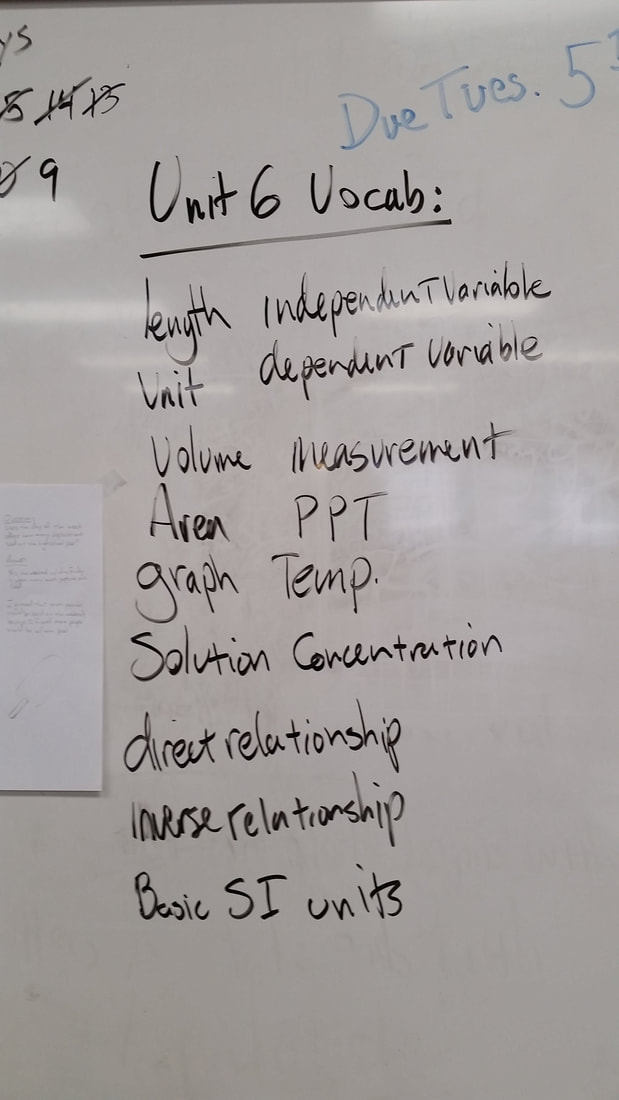
Vocabulary: taken from text and class conversations
Project: Graphing project
Section Review/Study Questions: Section review questions 1.1, 1.2, 1.3
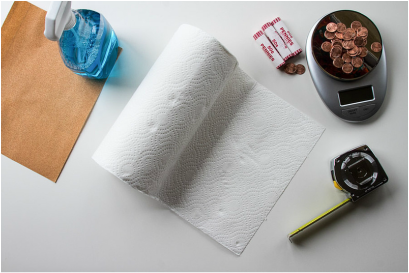
Lab/Final Activity: Measurement lab, "Sim Spill" Lab
Essential Question (written response): Why is making information clear and reproducible important in science?
Quiz(s)/Test: Unit open note Test
S.I. Measurement
What would be the appropriate SI measurement for each of the following?
- Measurement is made of two parts _____________________ and ______________.
- This is the measurement of how much space something occupies.________________
- What would be the most appropriate S.I. measurement to measure the distance from Oakhurst to Fresno? _______________________________________________
- How many centimeters in a meter? ______________________________
- What is the volume of the object below? ___________(2 points)
- What is a unit? ____________________________________
- In the S.I. what unit is used to measure liquid volume? ___________________
- What is a solute?
- Measure and label each line below using MM, CM, and M.
- Find the volume of the containers below. Remember they must be labeled correctly.
What would be the appropriate SI measurement for each of the following?
- A car (bumper to bumper) ________________
- A cars weight _________________
- A cars inside space __________________
- A mouse (length) _____________
- The distance from here to Bakersfield ___________________
- How much area is in a football field ___________________
- How much sugar is dissolved in a soda _________________
- Capacity of a car’s gas tank ____________________
Scientific Method Review
For the problem that follows you need to write out the steps of the scientific method as they apply to this problem and design an experiment to test your hypothesis. For your experiment you will need to identify the variables including the experimental variable, how you’ll keep the other variables constant (not changing) and the method of exactly how to complete the experiment, step by step. Your explanation will end at the point of gathering data, you won’t have any to gather and I don’t want you to make data up. (You can create situations for the purposes of this experiment on this worksheet that you might not be able to do at school for real). Use OCI as your possible test subjects.
The situation is that you need to find out which school lunch students like the most to least of the following lunches: Hamburgers, fries, apple slices and milk : Cheese pizza, salad, fresh fruit cup and milk: Ham sandwich, chips, grapes and milk: Peanut Butter and jelly sandwich, watermelon slice, pretzels, and milk.
Problem:_________________________________________________________
Hypothesis:_______________________________________________________
________________________________________________________________
Variables to be controlled (one per line): ________________________________________________________________________________________________________________________________________________________________________________________________________________________________________________________________________________________________________________________________________________________________________________________________________________________________________________________________________________________________________________________________________________________________________Experimental Variable: ___________________________________________________ _____________________________________________________________________
(See back side)
Test hypothesis (experiment) explain the procedure ________________________
_________________________________________________________________________________________________________________________________________________________________________________________________________________________________________________________________________________________________________________________________________________________________________________________________________________________________________________________________________________________________________________________________________________________________________________________________________________________________________________________________________________________________________________________________________________________________________________________________________________________________________________________________________________________________________________________________________________________________________________________________________________________________________________________________________________________________________________________________________________________________________________________________________________________________________________________________________________________________________________________________________________________________________________________________________________________________________________________________________________________________________
Results: without knowing the results, which graph would you use to show them and why? _______________________________________________________________________________________________________________________________________________________________________________________________________________
Graphing Review Sheet
Define the terms or answer the questions below in sentence form.
- Graph
- Why is a bar graph used?
- Why is a line graph used?
- Why is a pie graph used?
- Independent variable
- dependent variable
- Where is the independent variable on a line graph?
- Where is the dependent variable on a line graph?
- inverse relationship
- direct relationship
- no relationship
- Use the following data to make the appropriate graph.
A. A motorcycle can drive 30 miles on a gallon of gas; 45 miles on 1.5 gallons of gas; 90 miles on 3 gallons; 150 miles on 5 gallons; 210 on 7 gallons; and 300 miles on 10 gallons of gas.
B. When asked their favorite candy flavor this is what students reported:
Number of people responded Flavor
10 Grape
20 Watermelon
15 Apple
8 Lime
16 Orange
5 Blue Raspberry
C. When a student observed other students to find out what shirt color was being worn by fellow students that day they gathered this data:
Number of people viewed color
12 Red
18 White
27 Blue
18 Green
33 Pink
